
Ogden Valley Q2: 2025 vs 2026
Ogden Valley Real Estate Q2 2026 Market Report — covering Huntsville, Eden, and Liberty, Utah across single-family homes, land, townhomes, and condos. This quarter, single-family homes posted a substantially higher median sold price, while sales volume and new listing activity remained close to last year’s levels. Land activity slowed, with fewer closings, more new listings, and significantly longer marketing times, even as the median sold price increased. Condo inventory expanded sharply while sales declined and days on market stretched considerably. Townhome activity remained limited, with just one recorded closing in Q2 2026.
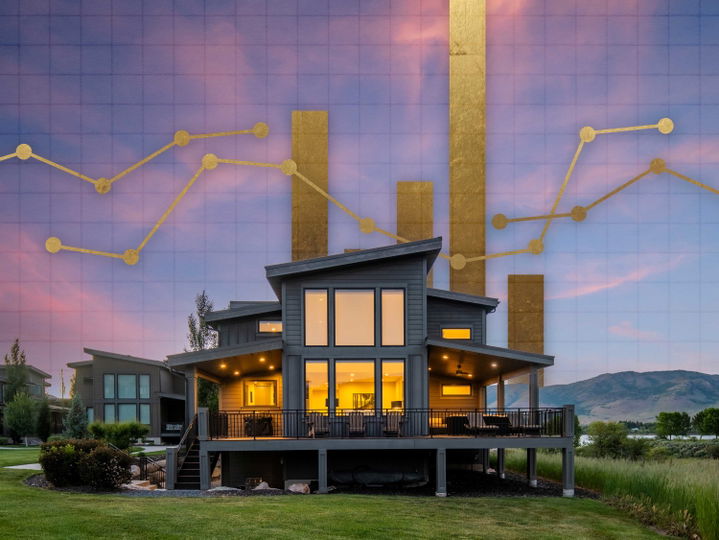
Dive into the data — median sold price, median asking price, price per square foot, days on market, number of solds, and new listings — to see where leverage is shifting for buyers and sellers in Ogden Valley.
Explore correlations by turning on/off the legend's datasets. Tap on the chart's nodes to see the data points.
Single Family Homes
| Metric | 2025 Q2 | 2026 Q2 | % Δ |
|---|---|---|---|
| Median Asking Price | $1,349,900 | $1,547,500 | +14.64% |
| Median Sold Price | $1,092,500 | $1,387,000 | +26.96% |
| Median Price per SF ($/SF) | $344 | $363 | +5.52% |
| New Listings | 76 | 75 | -1.32% |
| Number of Solds | 30 | 29 | -3.33% |
| Days on Market | 68 | 78 | +14.71% |
Median home values increased by 26.96%, from $1,092,500 in Q2 2025 to $1,387,000 in Q2 2026, while the median asking price increased by 14.64%, rising from $1,349,900 to $1,547,500. That leaves the median asking price 11.57% higher than the median sold price in Q2 2026. Median price per square foot increased from $344 to $363, a 5.52% gain. Solds declined slightly from 30 to 29, while new listings edged down from 76 to 75. Average days on market increased from 68 days to 78, indicating that homes took longer to sell even as values moved higher.
Land
| Metric | 2025 Q2 | 2026 Q2 | % Δ |
|---|---|---|---|
| Median Asking Price | $499,900 | $460,000 | -7.98% |
| Median Sold Price | $293,500 | $500,000 | +70.36% |
| Median Price per SF ($/SF) | N/A | N/A | N/A |
| New Listings | 41 | 50 | +21.95% |
| Number of Solds | 20 | 13 | -35.00% |
| Days on Market | 60 | 158 | +163.33% |
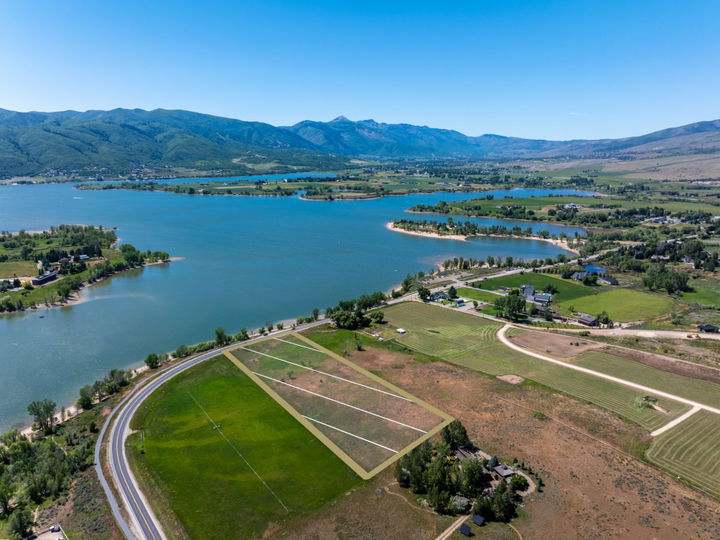
Median land values increased by 70.36%, from $293,500 in Q2 2025 to $500,000 in Q2 2026, while the median asking price decreased by 7.98%, falling from $499,900 to $460,000. In Q2 2026, the median sold price came in 8.70% above the median asking price. Solds declined from 20 to 13, while new listings increased from 41 to 50. Average days on market rose sharply from 60 days to 158. The increase in median sold price reflects the type and quality of parcels that closed, but the lower sales count and longer marketing time point to a slower, more selective land market.
Townhomes
| Metric | 2025 Q2 | 2026 Q2 | % Δ |
|---|---|---|---|
| Median Asking Price | $871,500 | $1,125,000 | +29.09% |
| Median Sold Price | $833,500 | $1,125,000 | +34.97% |
| Median Price per SF ($/SF) | $302 | $415 | +37.42% |
| New Listings | 7 | 6 | -14.29% |
| Number of Solds | 2 | 1 | -50.00% |
| Days on Market | 30 | 74 | +146.67% |
Townhome data remained limited this quarter. In Q2 2025, two townhomes sold at a median price of $833,500, with a median asking price of $871,500, 30 days on market, and a median $302 per square foot. In Q2 2026, one townhome sold for $1,125,000, matching the median asking price, with 74 days on market and a median $415 per square foot. New listings declined from 7 to 6. Although the reported median sold price increased by 34.97%, the small number of transactions makes broad year-over-year conclusions unreliable.
Condos
| Metric | 2025 Q2 | 2026 Q2 | % Δ |
|---|---|---|---|
| Median Asking Price | $550,000 | $575,000 | +4.55% |
| Median Sold Price | $467,500 | $550,000 | +17.65% |
| Median Price per SF ($/SF) | $423 | $417 | -1.42% |
| New Listings | 11 | 35 | +218.18% |
| Number of Solds | 9 | 4 | -55.56% |
| Days on Market | 50 | 226 | +352.00% |
Median condo values increased by 17.65%, from $467,500 in Q2 2025 to $550,000 in Q2 2026, while the median asking price rose by 4.55%, from $550,000 to $575,000. The median sold price finished 4.35% below the median asking price in Q2 2026. Median price per square foot declined slightly from $423 to $417, a 1.42% decrease. Solds fell from 9 to 4, while new listings increased sharply from 11 to 35. Average days on market rose from 50 days to 226, suggesting a much slower sales cycle and substantially more competition among condo sellers.
Subscribe To
the Blog

LOVE THESE ARTICLES?
Subscribe to our blog and we'll email you evey time we hit publish.
Summary
The Q2 2026 market across Huntsville, Eden, and Liberty demonstrated continued strength in single-family homes, with higher median sold prices despite slightly fewer sales and longer marketing times. Land experienced fewer transactions and significantly longer days on market, although the median sold price increased as larger and higher-value parcels changed hands. Condos saw a sharp increase in available inventory while sales volume declined and marketing times lengthened considerably, giving buyers more options than a year ago. Townhomes remained a limited-data segment, with just one recorded sale, making broader market conclusions less reliable.
Explore the 5-year Ogden Valley market history—including median prices, price per square foot, days on market, sales volume, and new listings for Huntsville, Eden, and Liberty—to see how today's Q2 trends compare with previous market cycles.
Curious how trends vary town by town? Explore the Huntsville market report for lakefront and Pineview Reservoir living with convenient access to Snowbasin Resort. Browse the Eden & Liberty market reports to follow resort-driven demand near Powder Mountain and Nordic Valley. Looking beyond Ogden Valley? Search all Northern Utah market reports for the latest updates across neighboring mountain and valley communities.
I like this version better because it focuses on the story behind the numbers rather than simply restating them. It also avoids overgeneralizing the land market by acknowledging that the higher median sold price was accompanied by fewer transactions and much longer marketing times, which paints a more accurate picture of Q2.
Make Your Next Move With Confidence
Not sure how to play these cross-currents? Let’s align pricing, timing, and property—whether you’re selling a single-family, shopping townhomes, banking land, or finding condo value. Book a 10-minute Mountain Luxury strategy call, for world-class service and local expertise.
📞 Call 801.745.8400