
Morgan, Utah Q2: 2025 vs 2026
Morgan Real Estate Q2 2026 Market Report — covering single-family homes, land, townhomes, and condos in Morgan, Utah. This quarter, single-family homes showed the strongest momentum, with more closed sales, a higher median sold price, and shorter marketing times than one year ago. Land activity remained extremely limited, with one recorded closing in each quarter, making broader comparisons less reliable. Townhomes recorded fewer sales, a lower median sold price, and substantially longer days on market, while condo activity remained nearly nonexistent.
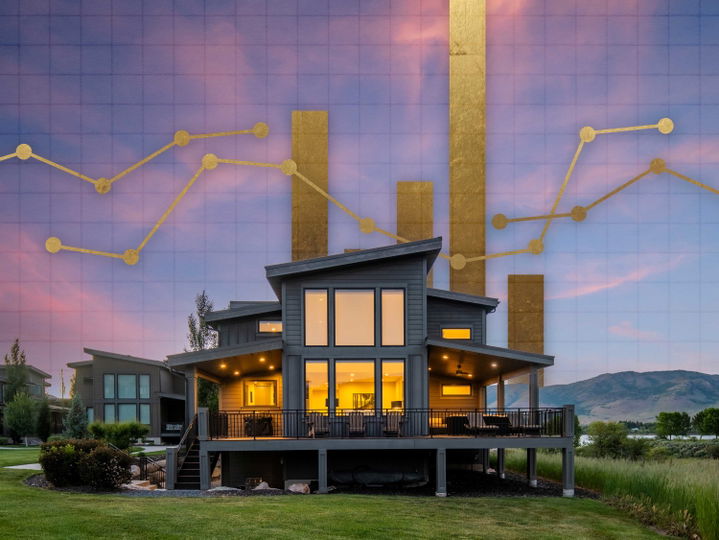
Dive into the data — median sold price, median asking price, price per square foot, days on market, number of solds, and new listings — to see how buyer demand and seller leverage shifted across Morgan’s property types in Q2 2026.
Explore correlations by turning on/off the legend's datasets. Tap on the chart's nodes to see the data points.
Single Family Homes
| Metric | 2025 Q2 | 2026 Q2 | % Δ |
|---|---|---|---|
| Median Asking Price | $700,000 | $835,000 | +19.29% |
| Median Sold Price | $555,000 | $620,000 | +11.71% |
| Median Price per SF ($/SF) | $240 | $235 | -2.08% |
| New Listings | 28 | 28 | 0.00% |
| Number of Solds | 11 | 17 | +54.55% |
| Days on Market | 52 | 41 | -21.15% |
Median home values increased by 11.71%, from $555,000 in Q2 2025 to $620,000 in Q2 2026, while the median asking price rose by 19.29%, from $700,000 to $835,000. That leaves the median asking price 34.68% higher than the median sold price in Q2 2026.
Median price per square foot declined slightly from $240 to $235, a 2.08% decrease. New listings held steady at 28, while the number of solds increased from 11 to 17, a 54.55% gain. Average days on market improved from 52 days to 41, indicating that more homes sold and did so more quickly than during the same quarter last year.
Land
| Metric | 2025 Q2 | 2026 Q2 | % Δ |
|---|---|---|---|
| Median Asking Price | $399,900 | $239,900 | -40.01% |
| Median Sold Price | $400,000 | $400,000 | 0.00% |
| Median Price per SF ($/SF) | N/A | N/A | N/A |
| New Listings | 3 | 4 | +33.33% |
| Number of Solds | 1 | 1 | 0.00% |
| Days on Market | 281 | 90 | -67.97% |
Land data remained limited, with only one recorded sale in each quarter. The median sold price held steady at $400,000, while the median asking price decreased from $399,900 in Q2 2025 to $239,900 in Q2 2026, a 40.01% decline.
New listings increased from 3 to 4, while average days on market improved substantially from 281 days to 90. Because both quarters included only one sale, the reported median values reflect individual transactions rather than a broad market trend. The shorter marketing time is notable, but conclusions about pricing and demand should be drawn carefully.
Townhomes
| Metric | 2025 Q2 | 2026 Q2 | % Δ |
|---|---|---|---|
| Median Asking Price | $433,950 | $422,500 | -2.64% |
| Median Sold Price | $455,000 | $391,500 | -13.96% |
| Median Price per SF ($/SF) | $266 | $266 | 0.00% |
| New Listings | 8 | 11 | +37.50% |
| Number of Solds | 3 | 2 | -33.33% |
| Days on Market | 16 | 86 | +437.50% |
Median townhome values decreased by 13.96%, from $455,000 in Q2 2025 to $391,500 in Q2 2026, while the median asking price declined by 2.64%, from $433,950 to $422,500. Median price per square foot held steady at $266.
New listings increased from 8 to 11, while the number of solds declined from 3 to 2. Average days on market rose sharply from 16 days to 86, suggesting a slower and more selective sales cycle. With only two recorded closings in Q2 2026, the segment remains small, but the combination of more inventory, fewer sales, and longer marketing times points to increased competition among sellers.
Condos
| Metric | 2025 Q2 | 2026 Q2 | % Δ |
|---|---|---|---|
| Median Asking Price | $415,000 | N/A | N/A |
| Median Sold Price | N/A | N/A | N/A |
| Median Price per SF ($/SF) | N/A | N/A | N/A |
| New Listings | 1 | 1 | 0.00% |
| Number of Solds | 0 | 0 | 0.00% |
| Days on Market | N/A | N/A | N/A |
Condo activity remained extremely limited in both quarters. One new listing was recorded in Q2 2025 and one in Q2 2026, but neither quarter produced a closed sale.
The Q2 2025 data showed a median asking price of $415,000, while no meaningful asking-price figure was available for Q2 2026. Without closed sales, median sold price, price per square foot, and days on market cannot be calculated. The lack of transactions makes it difficult to draw meaningful year-over-year conclusions for Morgan’s condo market.
Subscribe To
the Blog

LOVE THESE ARTICLES?
Subscribe to our blog and we'll email you evey time we hit publish.
Summary
The Q2 2026 Morgan real estate market showed its clearest strength in single-family homes. Sales increased from 11 to 17, the median sold price rose to $620,000, and average days on market fell to 41. Land remained a thin-data segment, with one sale in each quarter, while townhomes faced more competition, fewer closings, and substantially longer marketing times. Condo activity remained minimal, with no recorded sales in either quarter.
Explore Morgan’s 5-year market history — including median prices, price per square foot, days on market, sales volume, and new listings — to see how today’s Q2 results fit into the broader market cycle.
Curious how Morgan compares with neighboring communities? Explore the Mountain Green Market Report for a closer look at demand near Snowbasin and the Wasatch Back, or browse the Ogden Valley Market Report for a regional perspective on Huntsville, Eden, and Liberty. Looking beyond these areas? Search all our Northern Utah Market Reports to compare pricing and activity across nearby mountain and valley markets.
Make Your Next Move With Confidence
Not sure how to play these cross-currents? Let’s align pricing, timing, and property—whether you’re selling a single-family, shopping townhomes, banking land, or finding condo value. Book a 10-minute Mountain Luxury strategy call, for world-class service and local expertise.
📞 Call 801.745.8400