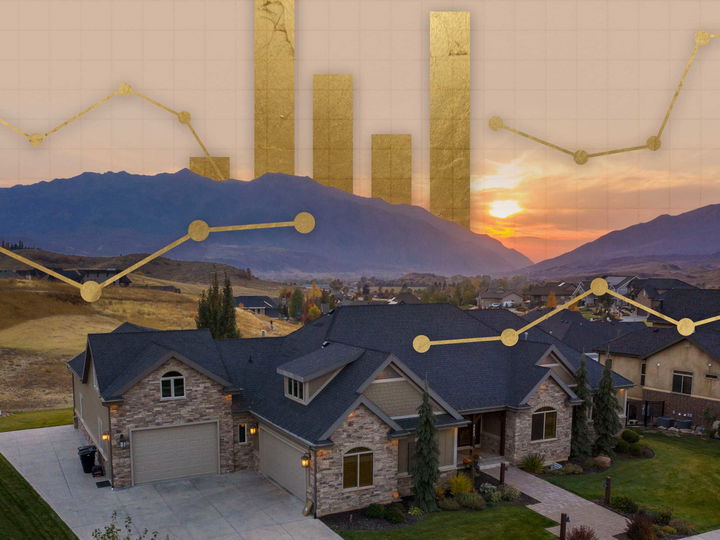

Mountain Green, Utah Q2: 2025 vs 2026
Mountain Green Real Estate Q2 2026 Market Report — covering single-family homes, land, and townhomes in Mountain Green, Utah. This quarter, single-family home prices moved sharply higher, but sales volume fell and homes took longer to sell. Land activity remained limited, with fewer closings despite more new listings, while median sold prices declined. Townhome activity improved from no recorded sales in Q2 2025 to five closings in Q2 2026, giving the segment a clearer performance benchmark.
Dive into the data — median sold price, median asking price, price per square foot, days on market, number of solds, and new listings — to see how buyer demand and seller leverage shifted across Mountain Green in Q2 2026.
Explore correlations by turning on/off the legend's datasets. Tap on the chart's nodes to see the data points.
Single Family Homes
| Metric | 2025 Q2 | 2026 Q2 | % Δ |
|---|---|---|---|
| Median Asking Price | $1,060,000 | $1,432,500 | +35.14% |
| Median Sold Price | $858,180 | $1,125,000 | +31.09% |
| Median Price per SF ($/SF) | $222 | $288 | +29.73% |
| New Listings | 29 | 19 | -34.48% |
| Number of Solds | 21 | 5 | -76.19% |
| Days on Market | 32 | 51 | +59.38% |
Median home values increased by 31.09%, from $858,180 in Q2 2025 to $1,125,000 in Q2 2026, while the median asking price rose by 35.14%, from $1,060,000 to $1,432,500. That leaves the median asking price 27.33% higher than the median sold price in Q2 2026.
Median price per square foot increased from $222 to $288, a 29.73% gain. New listings declined from 29 to 19, while the number of solds fell from 21 to 5. Average days on market increased from 32 days to 51. The quarter reflects stronger pricing among the homes that closed, but significantly lower transaction volume and a longer sales cycle.
Land
| Metric | 2025 Q2 | 2026 Q2 | % Δ |
|---|---|---|---|
| Median Asking Price | $400,000 | $369,000 | -7.75% |
| Median Sold Price | $515,000 | $356,250 | -30.83% |
| Median Price per SF ($/SF) | N/A | N/A | N/A |
| New Listings | 5 | 9 | +80.00% |
| Number of Solds | 3 | 2 | -33.33% |
| Days on Market | 128 | 112 | -12.50% |
Median land values decreased by 30.83%, from $515,000 in Q2 2025 to $356,250 in Q2 2026, while the median asking price declined by 7.75%, from $400,000 to $369,000.
New listings increased from 5 to 9, while solds declined from 3 to 2. Average days on market improved from 128 days to 112, though land continued to require a lengthy marketing period. With only two recorded sales in Q2 2026, the median sold price reflects a small group of transactions, but the combination of more inventory and fewer closings suggests buyers had more choice and greater leverage.
Townhomes
| Metric | 2025 Q2 | 2026 Q2 | % Δ |
|---|---|---|---|
| Median Asking Price | $619,900 | $584,900 | -5.65% |
| Median Sold Price | N/A | $602,000 | N/A |
| Median Price per SF ($/SF) | N/A | $379 | N/A |
| New Listings | 2 | 3 | +50.00% |
| Number of Solds | 0 | 5 | N/A |
| Days on Market | N/A | 58 | N/A |
Townhome activity increased meaningfully from the prior year. Q2 2025 recorded two new listings but no closed sales, leaving no year-over-year benchmark for median sold price, price per square foot, or days on market.
In Q2 2026, five townhomes sold at a median price of $602,000, with a median $379 per square foot and 58 days on market. The median asking price declined by 5.65%, from $619,900 in Q2 2025 to $584,900 in Q2 2026, while new listings increased from 2 to 3. The return of closed-sale activity provides a stronger picture of townhome demand, though the relatively small number of transactions still calls for careful interpretation.
Subscribe To
the Blog

LOVE THESE ARTICLES?
Subscribe to our blog and we'll email you evey time we hit publish.
Summary
The Q2 2026 Mountain Green real estate market delivered higher pricing but slower activity in the single-family segment. Median sold price and price per square foot rose sharply, while sales volume declined and days on market increased. Land remained limited and selective, with fewer closings and a lower median sold price despite additional inventory. Townhomes were the clearest area of renewed activity, moving from no recorded sales in Q2 2025 to five closings in Q2 2026.
Explore Mountain Green’s 5-year market history — including median prices, price per square foot, days on market, sales volume, and new listings — to see how today’s Q2 results fit into the broader market cycle.
Curious how Mountain Green compares with nearby communities? Explore the Morgan Market Report for a look at pricing and activity farther east, or browse the Ogden Valley Market Report for trends across Huntsville, Eden, and Liberty. Looking beyond these areas? Search all of our Northern Utah Market Reports to compare neighboring mountain and valley communities.
Make Your Next Move With Confidence
Not sure how to play these cross-currents? Let’s align pricing, timing, and property—whether you’re selling a single-family, shopping townhomes, banking land, or finding condo value. Book a 10-minute Mountain Luxury strategy call, for world-class service and local expertise.
📞 Call 801.745.8400