


When the Utah Association of Realtors (UAR) releases their market update for Q3 2022 at the end of October, it will show the first quarterly median home price decline over 3% in the state of Utah since 2010. Dropping from $530,000 to $500,000 — a 5.7% decline. This value may get more media attention than the 4 recent monthly declines, but year over year gains are still up 6%. Come spring time, that number will probably be negative (we're already down 9% from May). The current trajectory might grant some relief to that number in Spring.
This month’s Utah Median Home Price results exceed last month's projection. We experienced a 2% decline in the latter half of the month, bringing the median price of homes in Utah to $490,000 — 9.2% down from May’s $540,000.
The future of home prices in Utah appear to climb... But is this the market feinting hope? The blue line in the graph below shows pending home prices in the state which have dropped 1% to $490,000, then risen back to $495,000. After posting this article, late data came in pushing that pending number to $500,000. So, in theory property prices should recover, right? Interestingly, pending properties rise at the same time sold price drops. This is an example of pending properties shifting to sold. The volume of properties entering the pool during this time frame was approximately 300, while the number of properties sold was 600. This anomaly shifts the data upwards with 15% of the pool disappearing in a short amount of time (probably because people rush to close at the end of the month, which isn't unusual). Unfortunately it's hard to judge whether this data rings true. It could be that a fewer number of listings close in October holding the median at a higher price. Should that be the case October will close higher, but it doesn't necessarily mean prices are going to recover.
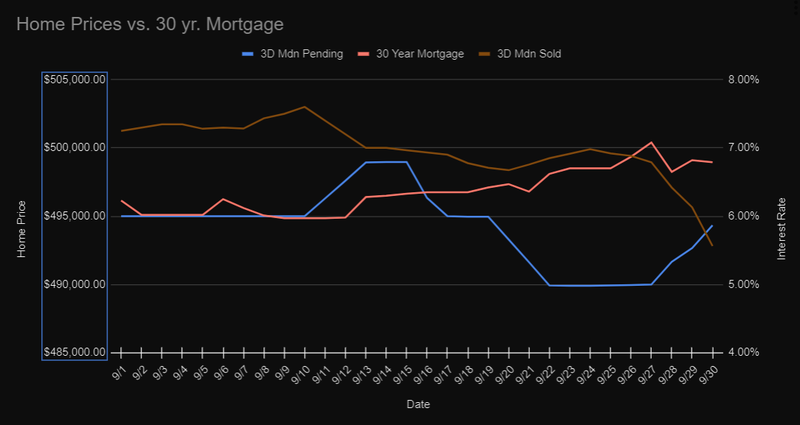
“We have got to get inflation behind us. I wish there was a painless way to do that… There isn’t.” That was the Fed Chair, Jerome H. Powell, last Wednesday, a day before interest rates jumped 20BP (one basis point is 0.01%). You’ll notice in the graph you just looked at that interest rates have been rising the entire month. Here’s a brief overview of events affecting interest rates:
- 8/26 – Powell Jackson Hole Speech. 5.93% – 6.23% in four days.
Rates level out in the high fives.
- 9/13 – CPI Release. Rates jump 30BP to 6.28%.
- 9/16 – Fed stops purchasing MBS & anticipation of Powell Speech, +0.75 to fed rate.
Slow rise.
- 9/21 – Powell speaks. Rates drop for the day, then jump 20BP to 6.62%.
- 9/26 – UK tax cuts. 17BP jump to 6.87%.
- 9/27 – S&P Case-Shiller home price index reports first decline -0.4%. Peak at 7.08%.
- 9/28 – Bank of England (BOE) announces emergency bond purchases. 43BP drop to 6.65%. 17BP bounce up the following day to 6.82%.
- 9/30 – Core PCE (Personal Consumer Expenditures) release. Month ends at 6.79%.
This month contained quite the series of events. Luckily, we ended the month on a relatively positive note, but that doesn’t address the elephant in the room. Interest rates are brushing against 7%, which hasn’t been seen since 2002.
That brings into question the matter of housing affordability. The Housing Price to Income Multiple is a common measure of that. As James Wood, the Ivory-Boyer Senior Fellow at the Kem C. Gardner Policy Institute, puts it, “A multiple of less than 3 is considered very affordable, and a multiple of more than 5.1 is considered ‘Severely Unaffordable’.” In 2002, this indicator was 3.1 in Utah. Today, it’s estimated at 6.25.
Robert Shiller, one of the creators of the Case-Shiller Home Price Index (industry standard of measurement), called out the housing market saying “things look almost as bad” as the ’08 housing crisis. He cites the S&P Case-Shiller index suggesting that prices haven’t fallen meaningfully since ’07 to ’09. The Nobel Winning Economist said, “Prices are expected to fall by something a little over 10% by 2024 or 2025.” The index recently reported the first full point decline since January 2012.
Many Mortgage and Real Estate Organizations still expect the market to continue to increase while others expect only modest declines over the next year. It’s difficult to predict, but many indicators suggest that we need to seriously consider the possibility of a meaningful decline in the Utah housing market.
The housing market is suffering. That’s clear to see. As long as the decline doesn’t get out of hand, the Fed actually prefers a controlled decline. Can the Fed guess where prices will bottom? That’s up for debate.
I believe it’s important to distinguish between now and 2008. Many price similarities are occurring right now, but the reasons are different. The Great Recession was caused by the housing and mortgage market. Our current stick of dynamite has more to do with the government’s monetary policy and a housing boom/bust being a byproduct of that. Currently, home prices and mortgage rates are in a much stronger position to recover. However, that remains to be seen in the coming springs of 2023 and 2024.